This post will get straight to the point- Python code for generating a fractal image using IFS (Iterated Function System). Python is a simple language for scripting. I use PyCharm for coding, but you can do it other ways.
import numpy as np
from PIL import Image
import math

#color parameter space according to escape time

'''
Smaller images will generate really fast. You can change the dimensions to
thousands of pixels, but it will slow down the process.
'''
# width of image
width = 400
# height if image
height = 400
#number of color shades used
iterations = 16

'''
a, b, c, d define a square viewing window. The bigger the numbers, the smaller
the image in the window. They control scale of the image and general positioning.
Changing them moves center of the image and can warp the image.
'''

a = -2
b = -2
# bigger c and d values move image up
c = 2
d = 2


origin = [0, 0]

'''
If this number is too low you get an image with smoother and less fractal like
edges. Higher numbers also produce wider color bands.
'''
radius = 30  # defines a circular region in R2

#canvas is a coordinate space in R2. Third parameter is for color.
canvas = np.zeros((width, height, 3), dtype=np.uint8)
#fill canvas with a background color
canvas[0:width, 0:height] = [200, 0, 80]

def plot_points():
    # point p,q is on my canvas and colored based on escape time if it diverges
    for p in range(0, height):
        for q in range(0, width):
            ''' lambda point k, l in P in R2
            k and l are range bound by values of a,b,c,d
            code below scales a viewing window on the 2d canvas to keep in bounds.
            They are the starting point for the formula and cover each point in
            the 2d plane of size height and width but not at high precision.
            '''
            #print("k and l")
            k =  (a + ((c - a) * p/height))
            #print(k)
            l = (b + ((d - b) * q/width))
            #print(l)

            x = origin[0]
            y = origin[1]
            # this controls the number of color shades but increases run time
            for n in range (0, iterations):

                #get next value of the IFS.
                newx = x*x - y - k #Real - k
                newy = 2*x*y - y*y - l  #Imaginary - l
                #store new value for use in next iteration
                x = newx
                y = newy

                ''' less then radius fills in mandelbrot.
                greater than radius outlines mandelbrot. Note that
                distance is being computed from the origin.
                '''
                if (distance([x,y], origin) > radius):
                    '''
                    plot in color- convert and scale n to some shade of a color.
                    You can use any color algorithm you can imagine. n is a
                    measure of how many steps it takes until the orbit escapes
                    outside the radius of the circle.

                    color inversion:
                    (1 - n*colorScale/256)*256
                    '''
                    colorScale = 256/iterations
                    canvas[p, q] = [n*colorScale, 0,
                                    n*colorScale]
                    #print(n)
                    break

    #turn the data in the canvas array into an image and display it
    img = Image.fromarray(canvas, 'RGB')
    img.show()

def distance(a, b):
    #this is just the 2d distance formula
    return math.sqrt(math.pow(a[0] - b[0], 2) + math.pow(a[1] - b[1], 2))

if __name__ == '__main__':
    plot_points()
The Fractal Formula
Why this formula? It is the mandelbrot equation:
Zn+1 = Zn^2 + C where C is a constant value
Z = x + iy and is a complex number.
Squaring Z gives x^2 + 2ixy – y^2. For IFS approach, the formula is broken into real and imaginary coefficients. Those are the values being tested for divergence and shown below as newx and newy. Changing the formula will produce very crazy shapes you cannot get with other forms of math.
Crazy example 1
- newx = 2*x*x – y*y – k #Real – k
- newy = 4*x*x + 2*x*y – y – l #Imaginary – l
Crazy example 2
- newx = x*x – y*y – k #Real – k
- newy = 2*x*y – y – l #Imaginary – l
Crazy example 3
- newx = x*x – y*y – x – k #Real – k
- newy = 2*x*y – l #Imaginary – l
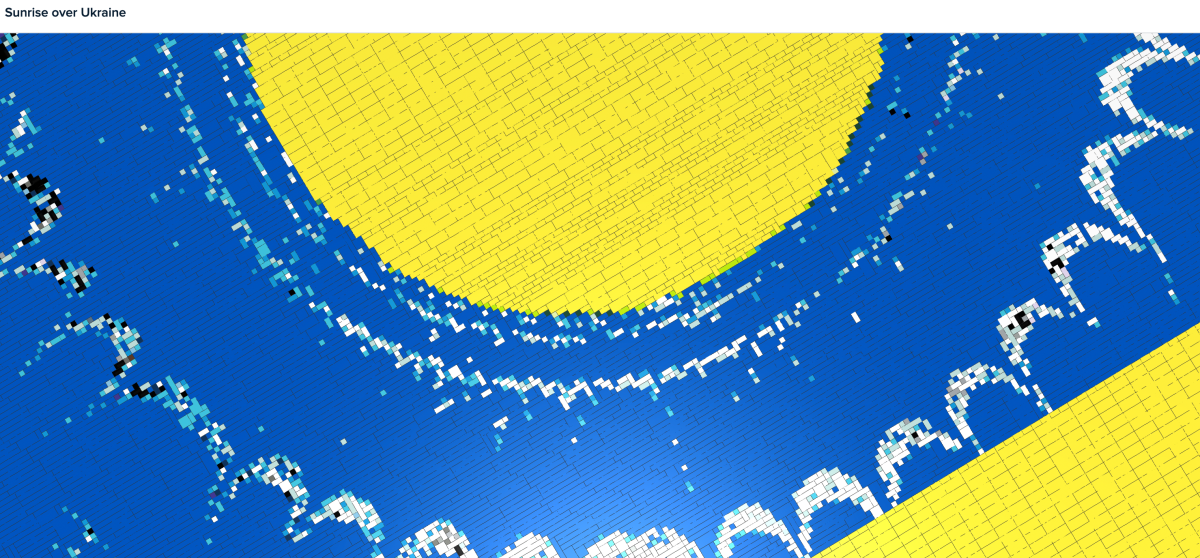
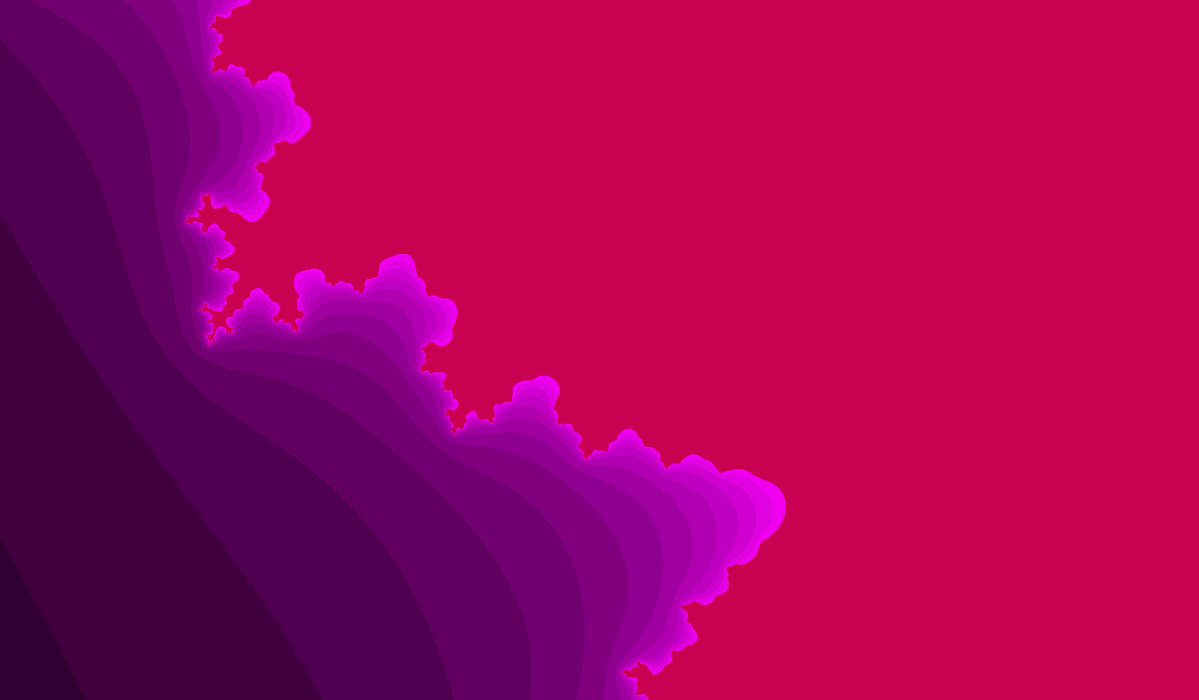
Crazy example 4 (image below)
- newx = x*x – y – k #Real – k
- newy = 2*x*y – y*y – l #Imaginary – l
Not all formulas will create a fractal!

More Variations
Values other than 0, 0 cause crazy distortions of the mandelbrot image. Changing the origin has a dramatic affect. You can make images that look like the map of a coast line. Best results have origin values between -1 and 1. Experiment by changing these and see what happens!
- origin = [0.37, -0.3]
- origin = [0.7, -0.6] #little numbers make big islands
- origin = [-.1, .3]
- origin = [0.3, .2]
- origin = [-.5, .3] l#ots of little islands off the big island
- origin = [-1.3, .4] #just little islands
- origin = [-1, -.8] #nice islands
- origin = [1, -.8] #changing the sign creates a mirror image (though not perfect!)
- origin = [.5, -.8] # big island with little islands
- origin = [.7, -.8] # big island with little islands
- origin = [-.7, -.8]
- origin = [1.5, 1.9] #empty image
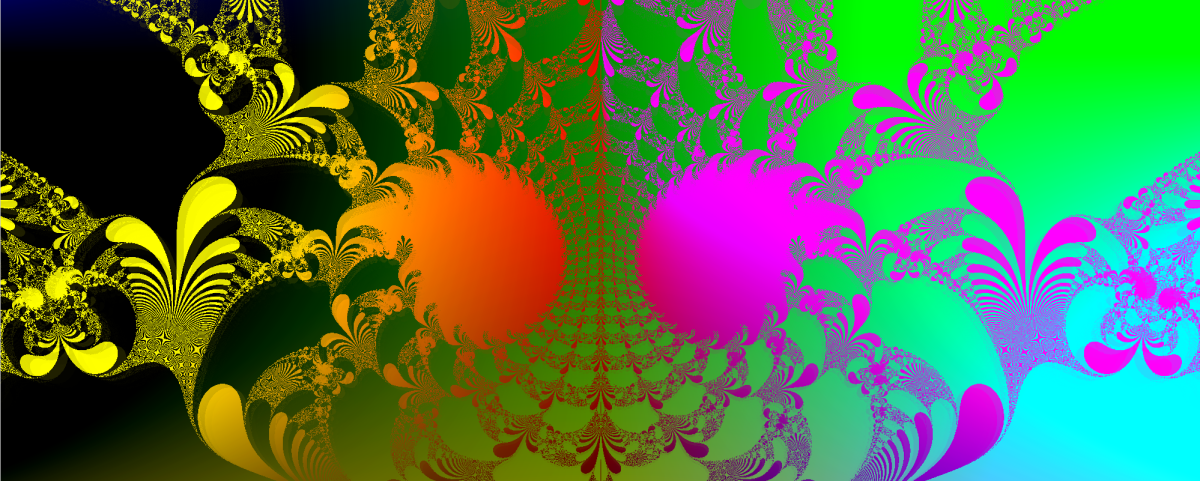
Using more advanced techniques can generate truly amazing images like the one below. This was made with the Java code I use for creating images for my clothing and other prouct at https://skyefractal.com
If you like these articles go get some swag from Skyefractal!